
OpenTelemetry Integration
Overview
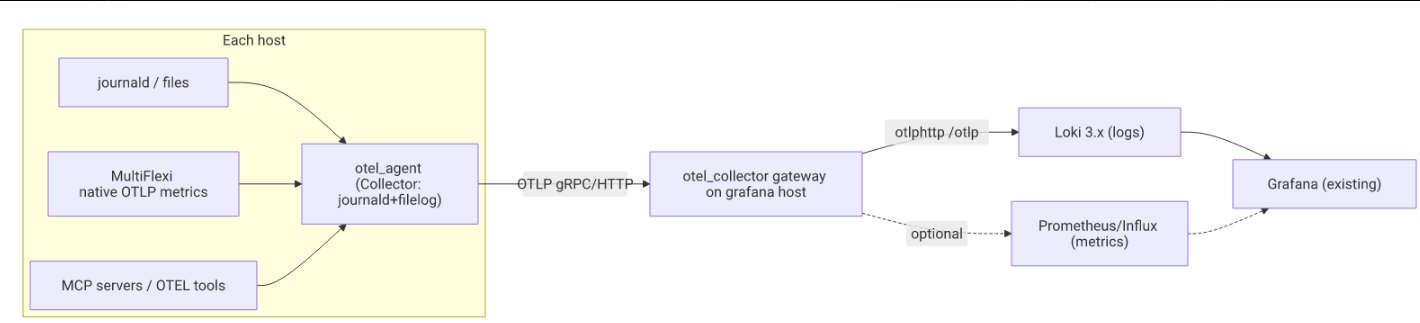
MultiFlexi supports exporting metrics to OpenTelemetry (OTel) compatible backends such as Prometheus, Grafana, Jaeger, and the OpenTelemetry Collector.
OpenTelemetry is a vendor-neutral, open-source observability framework that provides APIs, libraries, agents, and instrumentation to enable the collection and export of telemetry data (metrics, logs, and traces).
Why OpenTelemetry?
Vendor-agnostic: Works with any OpenTelemetry-compatible backend
Standardized: Industry-standard protocol (OTLP)
Comprehensive: Metrics, traces, and logs in one framework
Cloud-native: Built for modern distributed systems
Flexible: Export to multiple backends simultaneously
Coexistence with Zabbix
MultiFlexi’s OpenTelemetry integration runs alongside the existing Zabbix integration. Both can be enabled simultaneously:
Zabbix: Provides infrastructure monitoring and alerting
OpenTelemetry: Provides application performance metrics and distributed tracing
Available Metrics
MultiFlexi exports the following metrics to OpenTelemetry:
Counters
Metric Name |
Description |
|---|---|
|
Total number of jobs executed |
|
Number of successful jobs (exitcode=0) |
|
Number of failed jobs (exitcode≠0) |
Histograms
Metric Name |
Description |
|---|---|
|
Job execution duration in seconds |
Observable Gauges
These metrics are collected in real-time when the OTLP endpoint polls them:
Metric Name |
Description |
|---|---|
|
Currently running jobs |
|
Total number of applications |
|
Number of enabled applications |
|
Total number of companies |
|
Total number of run templates |
Metric Attributes
All metrics include the following attributes (where applicable):
job_id: Unique job identifierapp_id: Application IDapp_name: Application namecompany_id: Company IDcompany_name: Company nameruntemplate_id: RunTemplate IDruntemplate_name: RunTemplate nameexecutor: Executor type (Native, Docker, etc.)exitcode: Job exit code
Installation
Step 1: Install OpenTelemetry Dependencies
Install the required PHP packages using Composer:
cd /path/to/multiflexi
composer require open-telemetry/sdk open-telemetry/exporter-otlp
Step 2: Configure Environment Variables
Add the following environment variables to your configuration:
For Docker deployments (docker/.env):
# OpenTelemetry Configuration
OTEL_ENABLED=true
OTEL_SERVICE_NAME=multiflexi
OTEL_EXPORTER_OTLP_ENDPOINT=http://otel-collector:4318
OTEL_EXPORTER_OTLP_PROTOCOL=http/json
For systemd deployments (/etc/multiflexi/multiflexi.conf):
export OTEL_ENABLED=true
export OTEL_SERVICE_NAME=multiflexi
export OTEL_EXPORTER_OTLP_ENDPOINT=http://localhost:4318
export OTEL_EXPORTER_OTLP_PROTOCOL=http/json
For Apache/PHP-FPM (/etc/multiflexi/apache.conf or .htaccess):
SetEnv OTEL_ENABLED true
SetEnv OTEL_SERVICE_NAME multiflexi
SetEnv OTEL_EXPORTER_OTLP_ENDPOINT http://localhost:4318
SetEnv OTEL_EXPORTER_OTLP_PROTOCOL http/json
Configuration Options
Variable |
Description |
Default |
|---|---|---|
|
Enable/disable OpenTelemetry export |
|
|
Service identifier in OTLP |
|
|
OTLP collector endpoint URL |
|
|
Protocol ( |
|
Protocol Selection
MultiFlexi supports two OTLP protocols:
HTTP/JSON (recommended):
OTEL_EXPORTER_OTLP_ENDPOINT=http://localhost:4318
OTEL_EXPORTER_OTLP_PROTOCOL=http/json
gRPC (higher performance):
OTEL_EXPORTER_OTLP_ENDPOINT=http://localhost:4317
OTEL_EXPORTER_OTLP_PROTOCOL=grpc
Testing
Use the built-in CLI command to test your OpenTelemetry configuration:
multiflexi-cli telemetry:test
This command will:
Check if OpenTelemetry is enabled
Display current configuration
Send test metrics to the configured endpoint
Verify that the connection works
Example output:
Testing OpenTelemetry Metrics Export

Configuration:
  Service Name: multiflexi
  Endpoint: http://localhost:4318
  Protocol: http/json

Initializing OTel Metrics Exporter...
✓ Exporter initialized successfully

Testing job start metric...
✓ Job start metric recorded

Testing job end metrics...
  ✓ Success metric (exitcode=0, duration=5.5s)
  ✓ Failure metric (exitcode=1, duration=2.3s)

Testing observable gauges (real-time metrics)...
  ✓ multiflexi.jobs.running
  ✓ multiflexi.applications.total
  ✓ multiflexi.companies.total

Flushing metrics to OTLP endpoint...
✓ Metrics flushed successfully

Test completed successfully!
Deployment Architectures
Architecture 1: Direct to Prometheus
MultiFlexi → OpenTelemetry Collector → Prometheus → Grafana
Docker Compose Example:
version: '3.8'
services:
  multiflexi:
    image: vitexsoftware/multiflexi:latest
    environment:
      OTEL_ENABLED: "true"
      OTEL_EXPORTER_OTLP_ENDPOINT: "http://otel-collector:4318"
    depends_on:
      - otel-collector

  otel-collector:
    image: otel/opentelemetry-collector:latest
    command: ["--config=/etc/otel-collector-config.yaml"]
    volumes:
      - ./otel-collector-config.yaml:/etc/otel-collector-config.yaml
    ports:
      - "4318:4318"   # OTLP HTTP
      - "8889:8889"   # Prometheus metrics

  prometheus:
    image: prom/prometheus:latest
    volumes:
      - ./prometheus.yml:/etc/prometheus/prometheus.yml
    ports:
      - "9090:9090"

  grafana:
    image: grafana/grafana:latest
    ports:
      - "3000:3000"
    depends_on:
      - prometheus
OpenTelemetry Collector Configuration (otel-collector-config.yaml):
receivers:
  otlp:
    protocols:
      http:
        endpoint: 0.0.0.0:4318
      grpc:
        endpoint: 0.0.0.0:4317

processors:
  batch:

exporters:
  prometheus:
    endpoint: "0.0.0.0:8889"
  logging:
    loglevel: debug

service:
  pipelines:
    metrics:
      receivers: [otlp]
      processors: [batch]
      exporters: [prometheus, logging]
Prometheus Configuration (prometheus.yml):
global:
  scrape_interval: 15s

scrape_configs:
  - job_name: 'otel-collector'
    static_configs:
      - targets: ['otel-collector:8889']
Architecture 2: Cloud-Native Stack
MultiFlexi → OpenTelemetry Collector → Tempo (traces) + Prometheus (metrics) → Grafana
Architecture 3: Kubernetes Deployment
Use the OpenTelemetry Operator for Kubernetes to automatically instrument MultiFlexi pods.
Grafana Dashboard
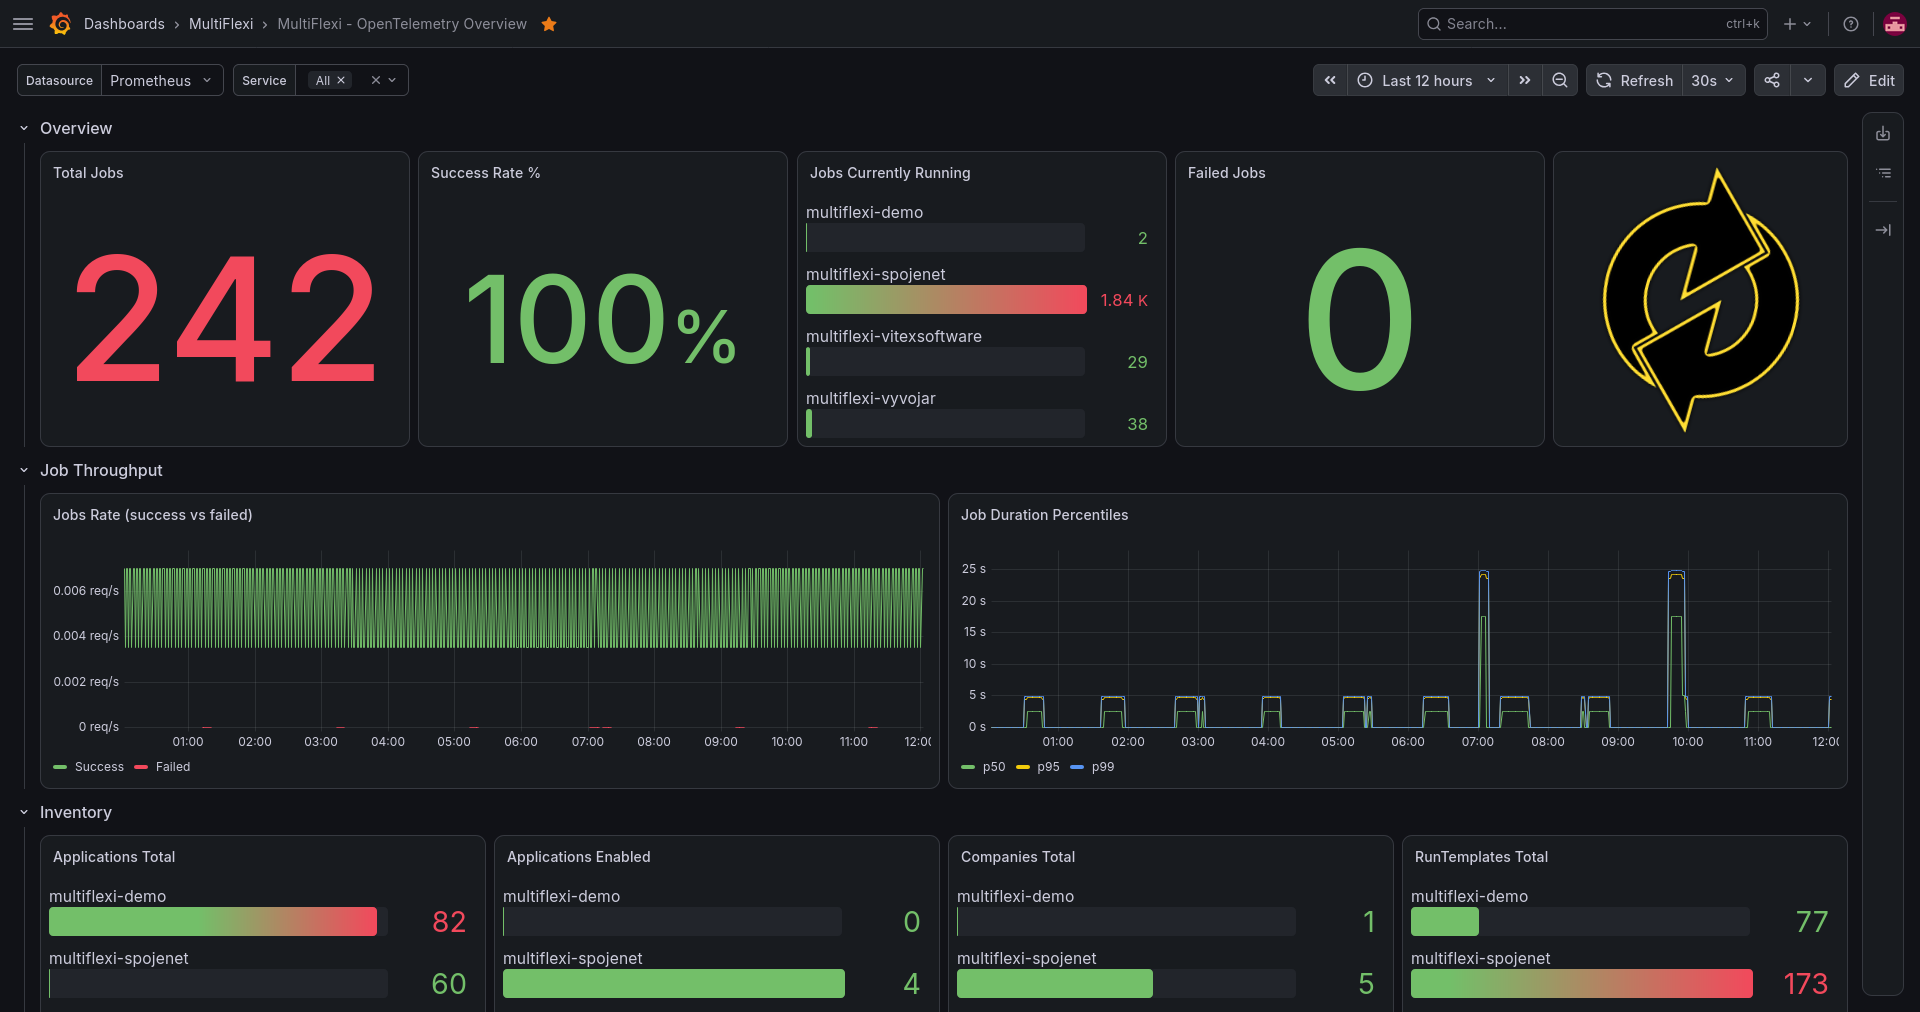
A pre-built dashboard (“MultiFlexi - OpenTelemetry Overview”) is provisioned as
Infrastructure-as-Code in the VSAnsible repository and ships with every
playbooks/grafana.yml run.
Import the Pre-Built Dashboard
The dashboard JSON lives at
files/grafana/dashboards/multiflexi-otel-overview.json in the
VSAnsible repository and is provisioned automatically into a dedicated
MultiFlexi Grafana folder:
cd VSAnsible
ansible-playbook playbooks/grafana.yml --tags otel_dashboards
Re-running the playbook after editing the JSON updates the dashboard in
place (the task is idempotent, diffed by dashboard uid). If you’d
rather import it by hand, upload the JSON file directly via Grafana’s
Dashboards → New → Import screen and select a Prometheus data source
when prompted.
The dashboard exposes a $service template variable
(label_values(multiflexi_jobs_total, otel_scope_name)) to filter by
host/instance. Note that otel_scope_name is currently just whatever
OTEL_SERVICE_NAME was set to per host — it is a rough per-host proxy,
not a dedicated resource attribute, so it may include ad hoc values (e.g.
from local telemetry:test runs) alongside real per-host service names.
Dashboard Panels
The pre-built dashboard ships four rows of panels:
Overview (Stat panels, respect the dashboard time range):
Total Jobs:
sum(increase(multiflexi_jobs_total{otel_scope_name=~"$service"}[$__range]))Success Rate %:
sum(increase(multiflexi_jobs_success_total{...}[$__range])) / sum(increase(multiflexi_jobs_total{...}[$__range])) * 100Jobs Currently Running:
multiflexi_jobs_running{otel_scope_name=~"$service"}Failed Jobs:
sum(increase(multiflexi_jobs_failed_total{...}[$__range]))
Job Throughput (time series):
Jobs Rate (success vs failed):
sum(rate(multiflexi_jobs_success_total{...}[5m]))and the_failed_totalequivalentJob Duration Percentiles (p50/p95/p99):
histogram_quantile(0.95, sum(rate(multiflexi_job_duration_seconds_bucket{...}[5m])) by (le))
Inventory (Stat panels, raw gauge values):
Applications Total / Enabled, Companies Total, RunTemplates Total
Breakdowns (bar gauges, sourced from the duration histogram’s _count series since it carries the richest label set):
Jobs by Application:
sum(increase(multiflexi_job_duration_seconds_count{...}[$__range])) by (app_name)Jobs by Company: same,
by (company_name)Jobs by Exit Code: same,
by (exitcode)
Example PromQL Queries
Job Success Rate:
sum(increase(multiflexi_jobs_success_total[1h])) /
sum(increase(multiflexi_jobs_total[1h])) * 100
Average Job Duration:
sum(rate(multiflexi_job_duration_seconds_sum[5m])) /
sum(rate(multiflexi_job_duration_seconds_count[5m]))
Failed Jobs by Application:
sum by (app_name) (
  rate(multiflexi_jobs_failed_total[5m])
)
Running Jobs:
multiflexi_jobs_running
Troubleshooting
OpenTelemetry Not Exporting Metrics
Check 1: Verify Configuration
multiflexi-cli status
multiflexi-cli telemetry:test
Check 2: Verify Endpoint Connectivity
curl -v http://localhost:4318/v1/metrics
Check 3: Check PHP Error Logs
tail -f /var/log/apache2/error.log
Check 4: Enable Debug Logging
Set MULTIFLEXI_DEBUG=true to see detailed OTel export messages.
Metrics Not Appearing in Prometheus
Check that OpenTelemetry Collector is receiving metrics:
curl http://localhost:8889/metricsVerify Prometheus is scraping the collector:
Check Prometheus UI → Targets →
otel-collectorCheck for metric name transformations:
OTel metrics may be renamed by the Prometheus exporter (dots → underscores)
Performance Impact
OpenTelemetry metrics export has minimal performance overhead:
CPU overhead: < 1% per job
Memory overhead: ~2MB for exporter initialization
Network: Batched exports every 10 seconds
Best Practices
Use batching: The default configuration batches metrics for efficiency
Monitor collector health: Set up alerts for OTLP collector downtime
Set retention policies: Configure Prometheus retention (default: 15 days)
Use labels wisely: Avoid high-cardinality labels (e.g., job_id in queries)
Start with HTTP/JSON: Simpler to debug than gRPC
Security
Securing OTLP Endpoint
Use TLS and authentication for production:
OTEL_EXPORTER_OTLP_ENDPOINT=https://otel-collector.example.com:4318
OTEL_EXPORTER_OTLP_HEADERS="Authorization=Bearer YOUR_TOKEN"
Network Segmentation
Run the OpenTelemetry Collector in a DMZ and restrict access:
MultiFlexi → Collector: Allow port 4318/4317
Collector → Prometheus: Allow port 9090
Collector → Internet: Deny (unless using cloud backends)
Further Reading
See Also
Configuration - General MultiFlexi configuration
MultiFlexi CLI - CLI commands reference
Execution Architecture - Execution architecture concepts
Execution Architecture - Docker deployment guide
Manage MultiFlexi using Ansible - Ansible deployment automation